
Calcpad has an interesting and undocumented feature, that I am going to reveal in this post. You can use it to quickly plot the Mandelbrot set. This is a set of complex numbers c, for which the iterative equation zn+1 = zn2 + c does not go to infinity. The most beautiful part is that it shows fractal behavior at its boundaries. If you plot it with the appropriate colors, you can create stunning images and animations. I really like those on the Maths Town’s YouTube channel:
Usually, such videos are created by complicated software, specially developed for that purpose. However, you can also plot the Mandelbrot set with Calcpad and a few lines of code. There are two ways to do that. The first one is to use the Calcpad capabilities for complex arithmetic, as follows:
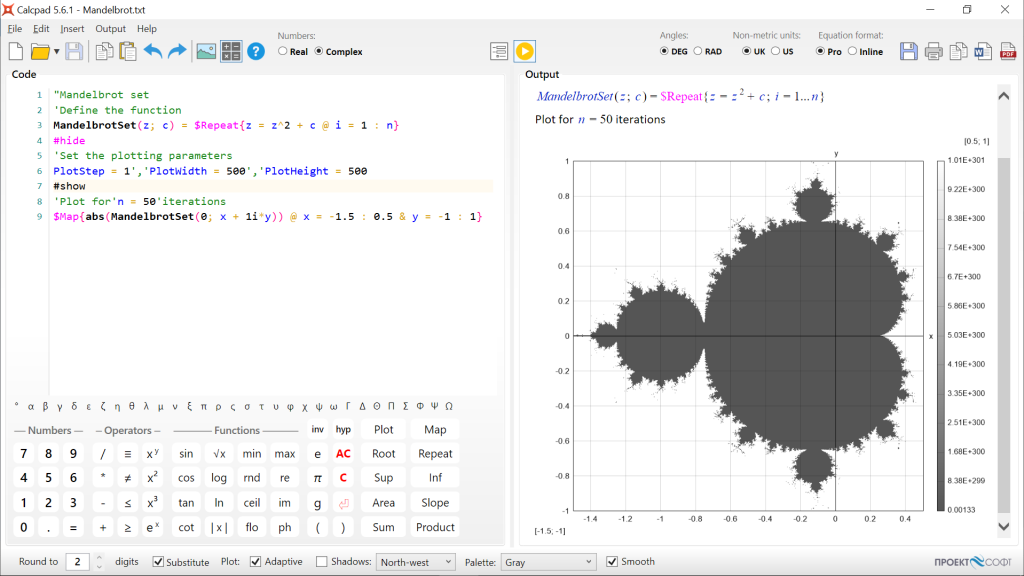
"Mandelbrot set
'Define the function
MandelbrotSet(z; c) = $Repeat{z = z^2 + c @ i = 1 : n}
#hide
'Set the plotting parameters
PlotStep = 1','PlotWidth = 500','PlotHeight = 500
#show
'Plot for'n = 50'iterations
$Map{abs(MandelbrotSet(0; x + 1i*y)) @ x = -1.5 : 0.5 & y = -1 : 1}
Open Calcpad, switch to “complex”mode, paste the above code inside, and run the calculations. You will get the following result:
It is not too bad, but still not very impressive. At least, the exterior is missing any colors. Then, how we can do the coloring? Theoretically, it is satisfied for all numbers in the set that |zn| < 2 for any n. Outside, the process diverges and the modulus goes to infinity, as n increases. You can use that in the following way:
1. For each point, calculate the number of iterations n, where |zn| gets larger than 2.
2. Map these values to colors.
3. Plot the colors at the respective coordinates.
If you play with the number of iterations n in the above example, you will see that the plot changes. The shaded area is where |zn| converges for the respective n.

If you combine the above plots and apply some colors, you can get really beautiful artistic image like the one bellow:

The only problem with this method is that it is slow and elaborate. That is why, I included a special function Mandelbrot(x; y) in Calcpad. It calculates the number of iterations, needed for the modulus to overpass 2. You can plot this function directly with the preferred color scale:


To do that, I used even shorter piece of code:
"Mandelbrot set
#hide
'Set the plotting parameters
PlotStep = 1','PlotWidth = 500','PlotHeight = 500
#show
'Plot for'n = 50'iterations
$Map{Mandelbrot(x; y) @ x = -1.5 : 0.5 & y = -1 : 1}
'Plot for'n = 70'iterations
$Map{Mandelbrot(x; y) @ x = -0.59 : -0.58 & y = 0.55 : 0.56}
Here you can find the C# code of the Mandelbrot function that works inside Calcpad:
        private static readonly double Log2Inv = 1 / Math.Log(2);
        //Calculates the number of iterations for which z = z^2 + c satisfies |z| > 2
        //Then transforms it to a smooth log scale and returns the result
        protected static double MandelbrotSet(double x, double y)
        {
            //Checks if the point is inside the set and directly returns NaN
            if (x > -1.25 && x < 0.375)
            {
                if (x < -0.75)
                {
                    if (y > -0.25 && y < 0.25)
                    {
                        double x1 = x + 1,
                            y2 = y * y,
                            x2 = x1 * x1;
                        if (x2 + y2 <= 0.0625)
                            return double.NaN;
                    }
                }
                else if (y > -0.65 && y < 0.65)
                {
                    double x1 = x - 0.25,
                        y2 = y * y,
                        q = x1 * x1 + y2;
                    if (q * (q + x1) <= 0.25 * y2)
                        return double.NaN;
                }
            }
            //For all other points performs detailed calculations
            double re = x, im = y;
            for (int i = 1; i <= 1000; ++i)
            {
                double reSq = re * re,
                       imSq = im * im,
                       sumSq = reSq + imSq;
                //To avoid the sqrt function, the check |z| > 2 is replaced by z^2 > 4
                if (sumSq > 4)
                {
                    var logZn = Math.Log(sumSq) / 2;
                    var nu = Math.Log(logZn * Log2Inv) * Log2Inv;
                    return (1.01 - Math.Pow(i - nu, 0.001)) * 1000;
                }
                //Calculates z = z^2 + c
                im = 2 * re * im + y;
                re = reSq - imSq + x;
            }
            return double.NaN;
        }
    }
The complete source code is available on GitHub.
